

Pflugerville Housing Market Breakdown: June 2025
Published | Posted by Dan Price
Pflugerville Housing Market: Absorption Rates Stall Above $600K as Inventory Climbs – June 2025
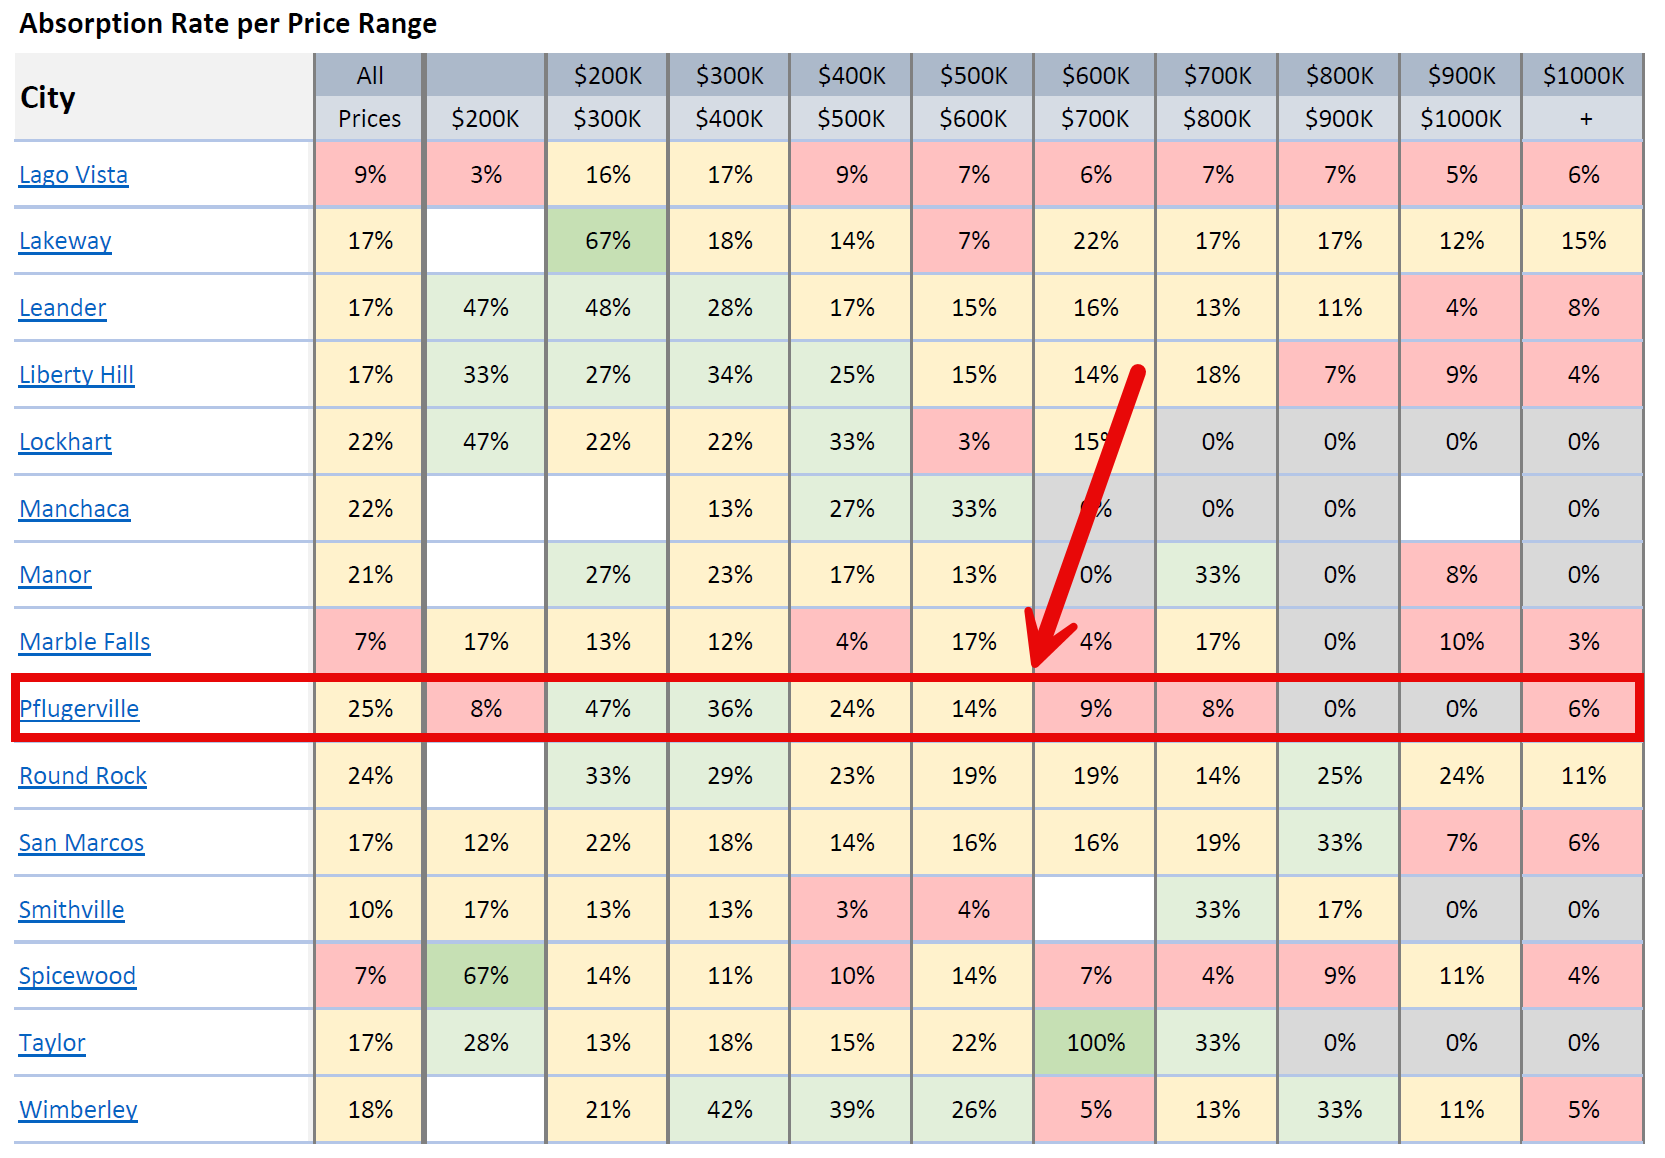
As of June 4, 2025, Pflugerville’s housing market presents a clear division between price segments. Based on data from Team Price Real Estate, there are 445 active residential listings in Pflugerville. The overall absorption rate—calculated as the number of homes sold in the past 30 days divided by current active listings—is 25%, indicating a neutral market condition across the city. However, this citywide percentage masks a steep drop in buyer activity above the $600,000 price range.
Homes priced under $600,000 are absorbing at a much healthier pace. For example, homes listed between $300,000 and $400,000 show a 47% absorption rate, while the $400,000 to $500,000 range sits at 36%. Even the $500,000 to $600,000 bracket still maintains a 24% rate. These numbers suggest that mid-range homes remain in relatively high demand, with active listings converting into pending contracts at a consistent rate.
By contrast, once prices exceed $600,000, the market behavior changes sharply. Team Price data shows that the absorption rate between $600,000 and $700,000 drops to 14%, and it falls even further for higher ranges: 9% for $700K–$800K, 8% for $800K–$900K, and effectively 0% for listings above $900K. In other words, almost no homes above $800,000 in Pflugerville are going under contract based on recent sales activity.
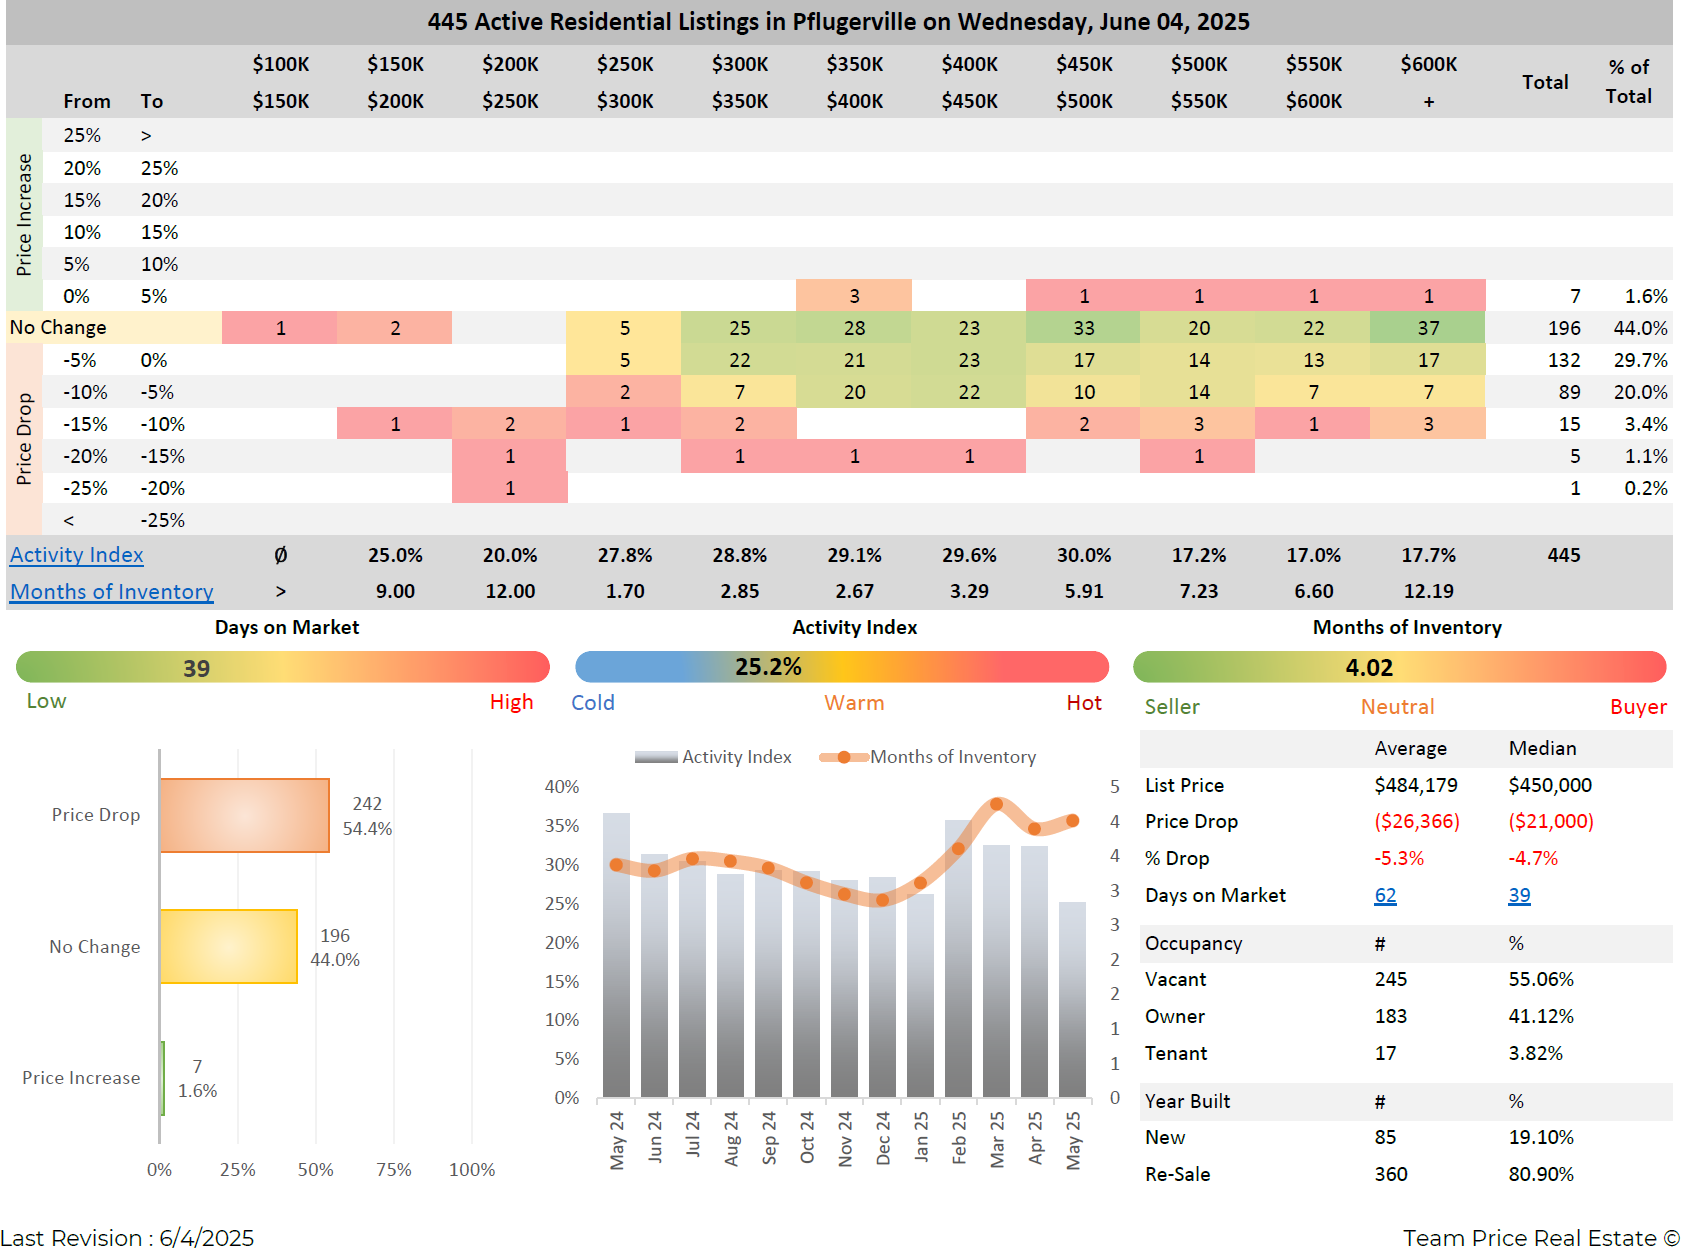
This is further supported by inventory data. Pflugerville’s overall months of inventory sits at 4.02, indicating a balanced-to-soft buyer's market. However, for homes priced above $600,000, months of inventory spike to 12.19, meaning it would take over a year to sell the existing inventory in that segment at the current pace, assuming no new listings are added. This is a hallmark of a deep buyer’s market in the higher price ranges.
The Activity Index, which tracks buyer activity by measuring the ratio of pending listings to total listings (active + pending), adds further clarity. Across all of Pflugerville, the Activity Index is 25%, but for listings over $600,000, it drops significantly to 17.7%. These metrics confirm that homes at higher price points are moving slower and face more headwinds compared to their mid-tier counterparts.
Price reductions are another indicator of seller motivation in a cooling segment. Of the 445 active listings in Pflugerville, 196 have experienced a price drop, representing 44% of the market. The average price drop is $26,366, with the median price cut at $21,000. This indicates that sellers are adjusting their expectations, particularly in price bands where inventory is piling up.
In terms of occupancy, 55% of active listings are vacant, which may contribute to pressure on sellers to reduce prices and move properties more quickly. Only 41% of properties are owner-occupied, with the remaining share likely representing investor-held or new construction homes. Additionally, new homes account for 19.1% of all active listings in the area, creating further competition in the already saturated upper end of the market.
The median list price across all active listings in Pflugerville is $450,000, while the average list price stands at $484,179. With price cuts becoming more common and demand softening in higher brackets, sellers with homes priced above $600,000 may need to adjust their strategies to match market realities.
Pflugerville's housing market remains relatively stable below $600,000, where buyer activity supports consistent absorption. However, for homes above this price point, inventory continues to outpace demand. With high months of inventory, low absorption rates, and a surge in price reductions, the data points to an increasingly competitive environment for high-end listings.
FAQ
1. What is the current absorption rate in Pflugerville?
As of June 4, 2025, the overall absorption rate in Pflugerville is 25%, meaning one in every four active listings is selling each month. This figure is based on 445 active listings and sales data from the past 30 days, as reported by Team Price Real Estate.
2. How does the market differ for homes priced above $600,000?
Homes listed above $600,000 show significantly lower demand. The absorption rate falls to just 14% for $600K–$700K homes and drops even further beyond that, with rates as low as 0% for homes above $900K. These properties also face 12.19 months of inventory—three times higher than the market average.
3. What does the Months of Inventory indicate about the Pflugerville market?
The overall Pflugerville market has 4.02 months of inventory, suggesting a neutral market. However, homes over $600,000 have 12.19 months of inventory, which points to a strong buyer’s market in that price range. A higher months-of-inventory figure typically signals slower turnover and less buyer urgency.
4. How prevalent are price drops in the Pflugerville housing market?
Approximately 44% of all active listings in Pflugerville have undergone a price reduction. The average price drop is $26,366, and the median price cut is $21,000. These reductions are more common in the higher price ranges where inventory is building and demand is slower.
5. What is the Activity Index and what does it show for Pflugerville?
The Activity Index, calculated as Pending Listings ÷ (Active + Pending Listings), measures current buyer activity. For all listings in Pflugerville, the index is 25%. However, for homes priced above $600,000, the index drops to 17.7%, confirming decreased buyer interest at higher price points.
Request Info
Have a question about this article or want to learn more?
